
How to Look Up Hidalgo County Jail Population Data
Population data does not sit in the inmate search tool. That tool finds one person at a time. Counts and trends come from oversight agencies instead. The Texas Commission on Jail Standards publishes monthly population reports for every county jail in the state, including capacity and daily counts. For national and multi-year context, the Bureau of Justice Statistics and the Vera Institute publish jail figures by state and county.
So a population lookup is really a matter of going to the right report. The county Sheriff's Office operates the detention functions and feeds its numbers to the state. If you want the live count for Hidalgo County, the state jail standards report is the official source to check, and it updates on a regular schedule.
Hidalgo County Jail Facilities and Capacity
The county runs two main custody facilities, and they serve very different groups. The adult detention facility holds adults booked by the sheriff and local police. The juvenile justice center holds young people under separate rules. The table below lists both. The official rated capacity for each is set and reported through the state, so the current figure should be read from the Texas Commission on Jail Standards report rather than assumed.
| Facility | Address | Capacity |
|---|---|---|
| Adult Detention Facility | 701 E. El Cibolo Rd., Edinburg, TX 78541 | See state jail standards report |
| Judge Mario E. Ramirez Jr. Juvenile Justice Center | 1001 N. Doolittle Rd., Edinburg, TX 78542 | See juvenile oversight report |
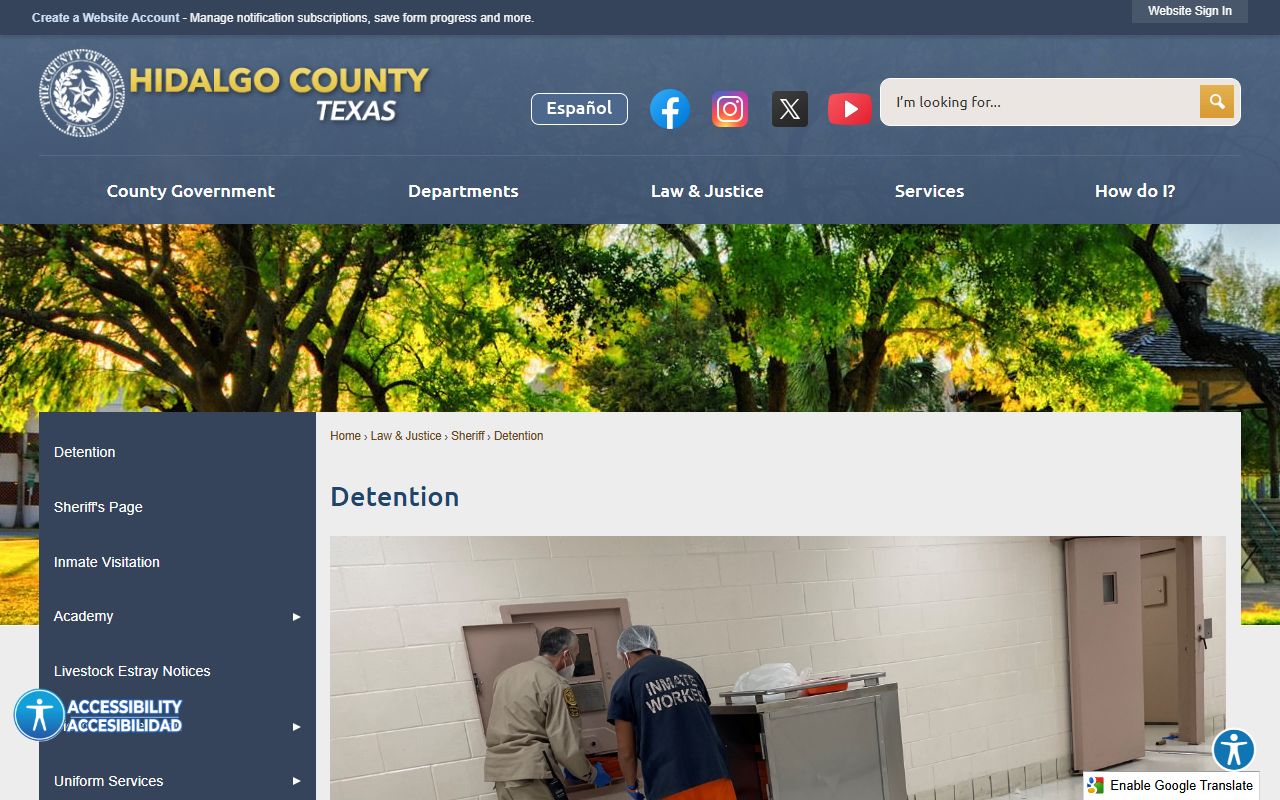
The county detention page divides public jail functions into inmate search, commissary, communications, and visitation. The Hidalgo County detention page is shown below.
Average Daily Population and What It Means
Average daily population, often shortened to ADP, is the workhorse metric for any jail. It is the mean number of people held over a set period, usually a month. ADP smooths out the daily swings that come from weekend arrests and court schedules, so it gives a steadier read on how full a facility runs. The Texas Commission on Jail Standards publishes this kind of figure for Hidalgo County in its monthly report.
ADP matters because it drives staffing, budget, and capacity planning. A jail that runs near its rated capacity has less room to absorb a spike. Reading ADP next to the rated capacity tells you how much slack a facility has. For the current Hidalgo County figure, pull the latest state report rather than relying on any single day's count.
Demographic Breakdown of the Jail Population
Population reports usually break the count into groups. Common splits include sex, age range, and the most serious charge class. These breakdowns help the county and the public understand who is held and why. The Hidalgo County detailed demographic split is not posted on the county pages reviewed here, so the state and federal reports are the place to read it.
When you do find the breakdown, read it with care. A snapshot count is not the same as a yearly flow. Many people pass through a jail in a year, far more than the count on any given day. So a demographic table shows who is held now, not everyone who was booked. For the front end of that flow, the arrest records page covers bookings.
Pretrial vs Sentenced Population
One of the most important splits in any county jail is pretrial versus sentenced. The difference shapes how the data should be read, and it often surprises people. The chart below explains the two groups.
| Group | Who They Are | Status |
|---|---|---|
| Pretrial | People held while their case is pending | Not convicted; awaiting court |
| Sentenced | People serving a county jail term | Convicted of an offense |
In most Texas county jails, a large share of the population is pretrial, meaning the case has not been decided. Bond decisions, court backlogs, and hearing schedules all move that number. For the cases behind these holds, use the court records search.
Misdemeanor vs Felony Population
The jail also holds a mix of charge levels. Felony defendants and sentenced misdemeanants share the same facility, but their paths differ. A felony case is tried in a district court and can carry a long sentence. A misdemeanor moves through a county court at law. Class C, fine-only matters rarely lead to a long jail stay, though an unpaid fine can land a person in custody on a capias pro fine.
This mix changes over time as filings and dispositions shift. The most serious charge usually drives how a person is counted in the data. To see how the courts split felony and misdemeanor work, see the Hidalgo County District Court page.
Mental Health and Medical Population
A share of every jail population needs mental health or medical care. The county detention schedule even names an infirmary among its housing sections, which signals on-site medical housing. The probate court's role in court-ordered mental health commitments is separate from the jail, but the two can intersect when a person in custody needs evaluation or treatment.
Detailed counts of the mental health and medical population in Hidalgo County are not posted on the county pages reviewed here. State and national reports track this group because it strains staffing and budgets. For the court side of involuntary commitments, see the probate records page.
State Oversight by the Texas Commission on Jail Standards
County jails in Texas do not run without a watchdog. The Texas Commission on Jail Standards sets minimum standards, inspects facilities, and publishes the monthly population reports that carry each county's count and capacity. That makes the commission the single most reliable source for current Hidalgo County jail numbers.
The commission's role is why the capacity in the table above points to its report rather than a fixed figure. Rated capacity can change with construction, variances, and inspections. When you need an official, current number for Hidalgo County, the state report is the document to cite.
National and State Context
To judge whether a county number is high or low, you compare it to the state and nation. Different agencies publish those layers, and each measures the count a little differently. The chart below shows where each level of jail population data comes from.
| Level | Main Source | What It Reports |
|---|---|---|
| County | Texas Commission on Jail Standards | Monthly count and capacity per jail |
| State | Bureau of Justice Statistics | Texas jail totals and rates |
| National | BJS and Vera Institute | U.S. jail counts and county trends |
Rates are often shown per 100,000 residents so counties of different sizes can be compared fairly. Read the Hidalgo County figure from the state report, then set it beside the BJS and Vera figures for context.
Population Trends Over Time
A single month's count says little on its own. Trends tell the real story. A jail population can rise with arrests and court backlogs, or fall when bond reform, diversion, or faster case processing take hold. The Vera Institute tracks county-level jail trends over years, and the state monthly reports build a running record for Hidalgo County.
To read a trend honestly, look across several months or years, not two data points. Seasonal swings and one-time events can distort a short window. The combination of state monthly reports and Vera's longer series gives the clearest view of where the Hidalgo County jail population is heading.
Budget and Staffing Context for the Jail
Jail population data does not stand alone. It drives the county budget, since a fuller jail costs more to staff, feed, and run. Hidalgo County operates as a functional arm of state government and lists law enforcement and jails among its core duties, alongside running the local court system. With about 3,300 county employees and 47 elected officials, the sheriff's detention operation is one of the larger pieces of the county's public-safety spending.
Staffing ratios are a key reason population numbers matter so much. State jail standards tie the number of officers a facility needs to the number of people held, so a rising count can force new hiring or overtime. The county's adopted budgets and monthly financial reports include the justice and court budgets that surround the jail, though the detailed jail capacity and staffing figures call for a deeper look at the budget documents themselves. Reading population data next to the budget shows the real cost of how full the jail runs.
Reading a Hidalgo County Population Report
A population report can look like a wall of numbers, but a few habits make it readable. Start with the rated capacity, then find the current or average count, and compare the two to see how full the jail runs. Next, look for the pretrial and sentenced split, since a high pretrial share points to bond and court-scheduling pressures rather than a wave of convictions. Finally, check the date of the report, because a stale figure can mislead.
Watch the difference between a snapshot and a flow. A one-day count names how many people are held at that moment, while the yearly number of bookings is far higher, since many people cycle in and out. Reading the wrong one leads to wrong conclusions. When you compare Hidalgo County to other counties, use a rate per 100,000 residents so size does not distort the picture.
Searching for Hidalgo County Inmate Records by Name
This page is about counts, not individuals. To look up one person, you use the jail roster instead, which searches by name or booking number. Population data and a name search answer different questions, so do not expect the population reports to name anyone. For an individual inmate, see the Hidalgo County inmate records page, and for release checks, see released inmates.
Where the Hidalgo County Data Comes From
To sum up the sourcing: the county Sheriff's Office runs the facilities and reports its numbers, the Texas Commission on Jail Standards publishes the monthly county count and capacity, and the Bureau of Justice Statistics and Vera Institute supply state and national context. Juvenile figures come through separate juvenile oversight, since that center is run apart from the adult jail.
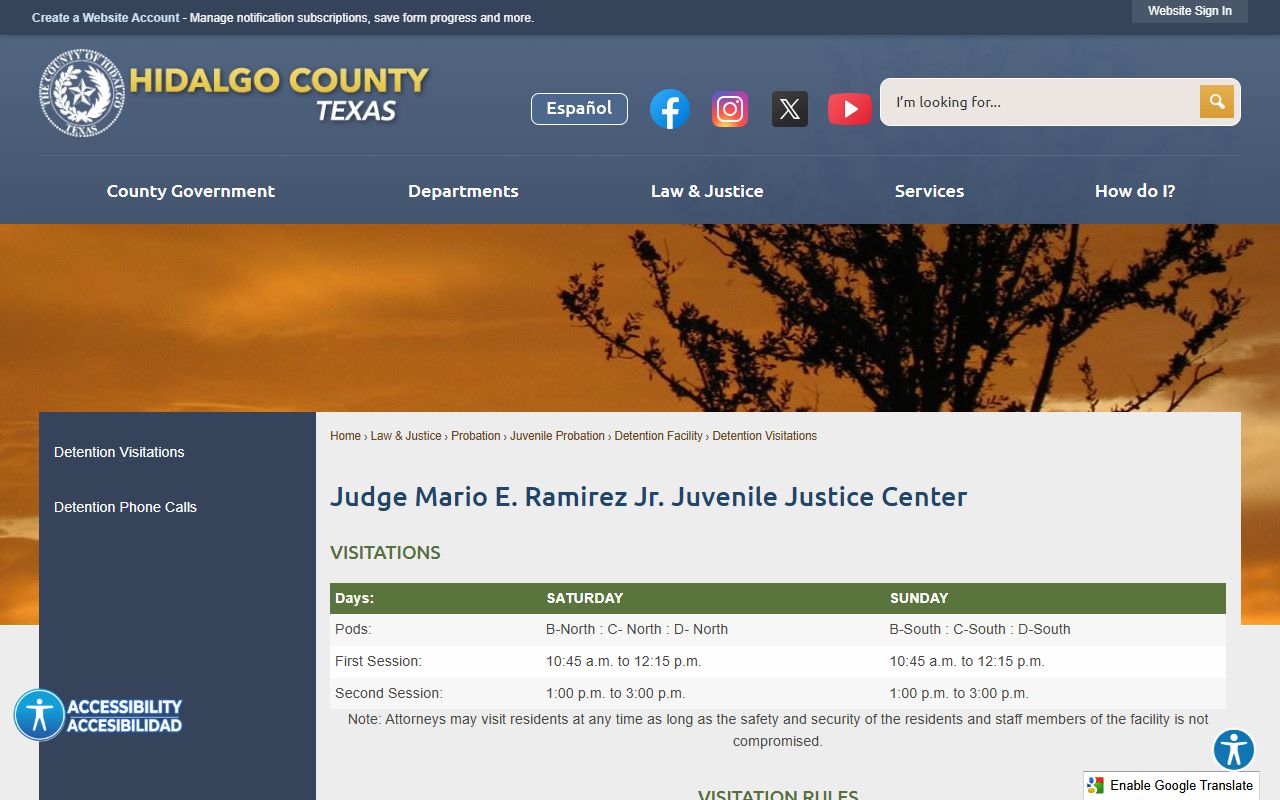
The county detention page is the gateway to the public jail functions that sit beneath these numbers. The juvenile side keeps its own rules and records. The juvenile detention visitation page is shown below.
For common questions about jail records, see the FAQ.